Mongo Debug Toolbar Panel
Changed in version 2.0.0.
Mongo Debug Toolbar Panel was completely rewritten in version 2.0.0. Before this version Mongo Debug Toolbar Panel used patching of main pymongo create/update/delete methods. This was not the best approach, as raised some compatibility issues during pymongo project updates. Since version 2.0.0 we use pymongo monitoring functions to track requests and timings. This approach completely removes patching of external packages and more compatibility friendly.
New approach require some user side actions to proper panel installation. This is done to exclude ‘silent’ registration of event loggers, to prevent performance degradation in external projects and in projects, that do not require Mongo Debug Toolbar Panel functional.
Described approach change brings several side effects, that user should be aware of:
Now Mongo Debug Toolbar Panel shows real database time, as reported by database engine. Excluding time required for data delivery from database instance to Flask instance.
Mongo Debug Toolbar Panel do not display and track tracebacks anymore. It only monitors database requests. Nothing more.
Mongo Debug Toolbar Panel do not do anything, if monitoring engine not registered before Flask application connection setup. Monitoring listener should be registered before first database connection. This is external requirement.
Mongo Debug Toolbar Panel code is now covered by internal tests, raising overall project code quality.
Mongo Debug Toolbar Panel can work without any usage of other
flask_mongoenginefunctions.Mongo Debug Toolbar Panel do not split requests types anymore, this is because now it handle any requests, including aggregations, collection creating/deleting and any other, reported by pymongo monitoring. Making splitting of incomming events will bring high complexity to parsers, as there are a lot of mongoDb commmands exist.
Installation
To install and use Mongo Debug Toolbar Panel:
Add
'flask_mongoengine.panels.MongoDebugPanel'toDEBUG_TB_PANELSof Flask Debug Toolbar.Import
mongo_command_loggerin your Flask application initialization file.Import
monitoringfrompymongopackage in your Flask application initialization file.Register
mongo_command_loggeras event listener inpymongo.Init Flask app instance.
Example:
import flask
from flask_debugtoolbar import DebugToolbarExtension
from pymongo import monitoring

from flask_mongoengine.panels import mongo_command_logger
from flask_mongoengine import MongoEngine


app = flask.Flask(__name__)
app.config.from_object(__name__)
app.config["MONGODB_SETTINGS"] = {"DB": "testing", "host": "mongo"}
app.config["TESTING"] = True
app.config["SECRET_KEY"] = "some_key"
app.debug = True
app.config["DEBUG_TB_PANELS"] = ("flask_mongoengine.panels.MongoDebugPanel",)
DebugToolbarExtension(app)
monitoring.register(mongo_command_logger)
db = MongoEngine()
db.init_app(app)
Note
Working toolbar installation code can be found and tested in example_app, shipped with project codebase.
Configuration
You can add MONGO_DEBUG_PANEL_SLOW_QUERY_LIMIT variable to flask application
config, to set a limit for queries highlight in web interface. By default, 100 ms.
Usage
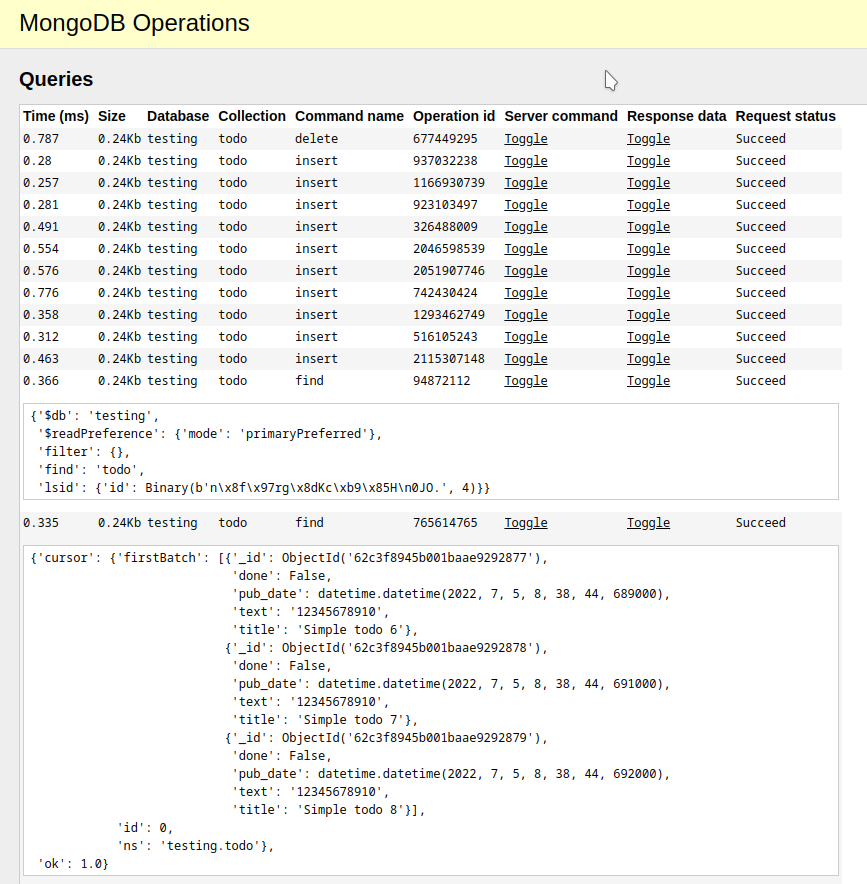
Mongo Debug Toolbar Panel logs every mongoDb query, in executed order.
You can expand
Server commandto check what command was send to server.You can expand
Response datato check raw response from server side.
Known issues
There is some HTML rendering related issues, that I cannot fix, as do not work with front end at all. If you have a little HTML/CSS knowledge, please help.
#469 Mongo Debug Toolbar Panel: Update HTML view to use wide screens
Objects sizes may be incorrect, as calculated in python. This part is copied from previous version, and may be removed in the future, if there will be confirmation, that this size data completely incorrect.